ChartMark - A Structured Grammar for Chart Annotation

Combined Group Bar
Combined Group Line
Combined Pie Chart
Combined Group Scatter
Bar Chart with Stroke
Line Chart with Label Line
Scatter Plot with Labels
Pie Chart with Reference
Group Line with Notes
Bar Chart with Opacity
Line Chart with Grid
Scatter Plot with Summary
Pie Chart with Notes
Group Bar with Reference
Group Line with Trend
Bar Chart with Range
Group Scatter with Labels
Line Chart with Notes
Group Line with Area
Scatter with Trend
Bar Chart with Labels
Line Chart with Stroke
Scatter with Data Line
Pie Chart with Global Note
ChartMark is a high-level grammar for chart annotation. It provides a concise, declarative JSON syntax to create expressive annotations for enhancing data visualizations and presentations.
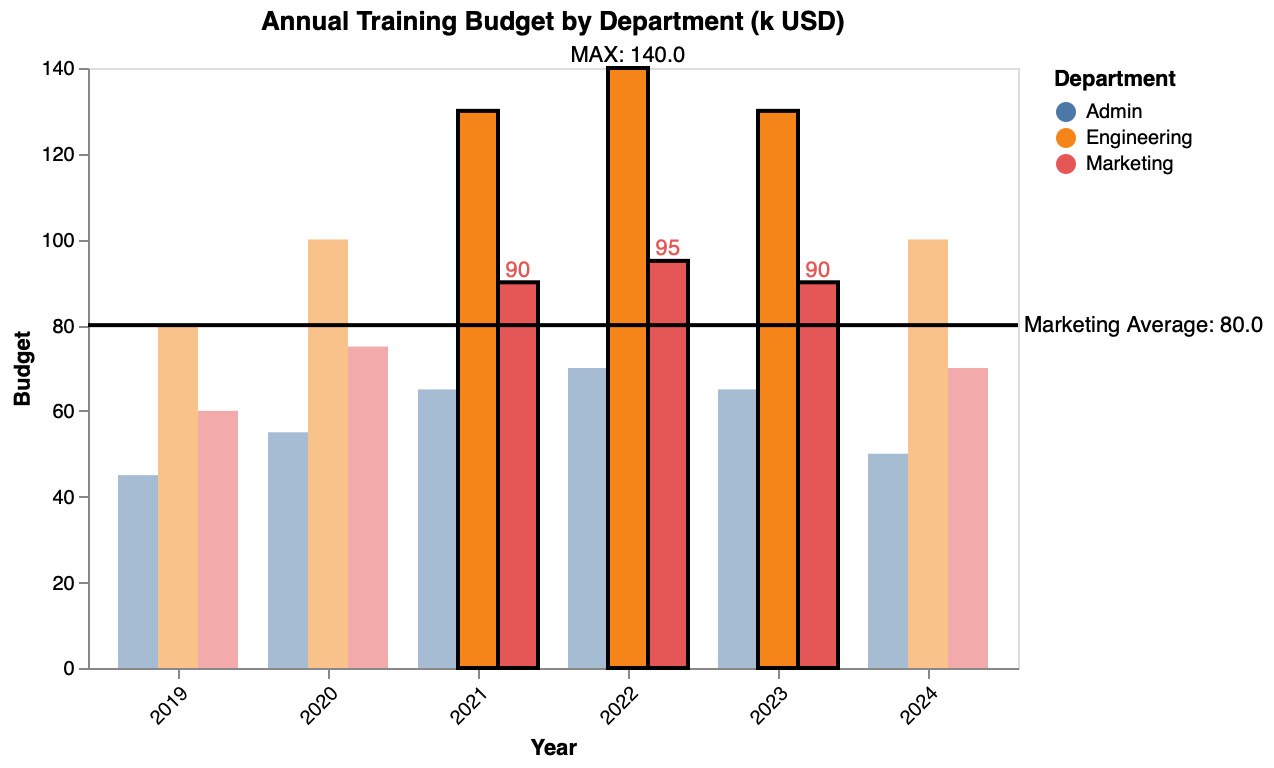
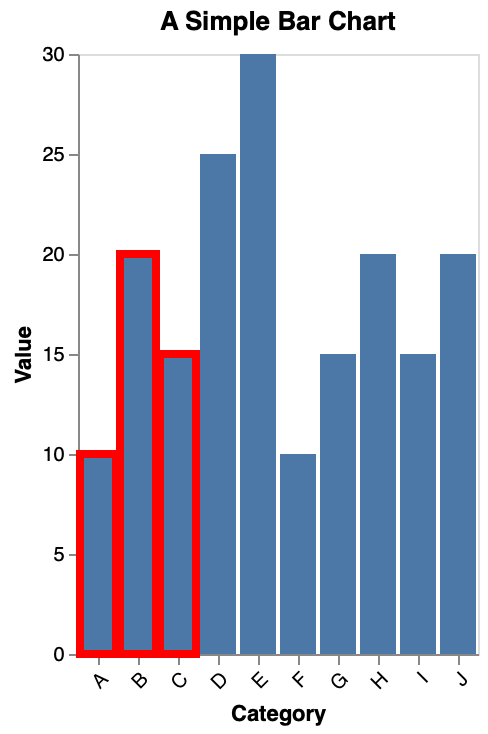
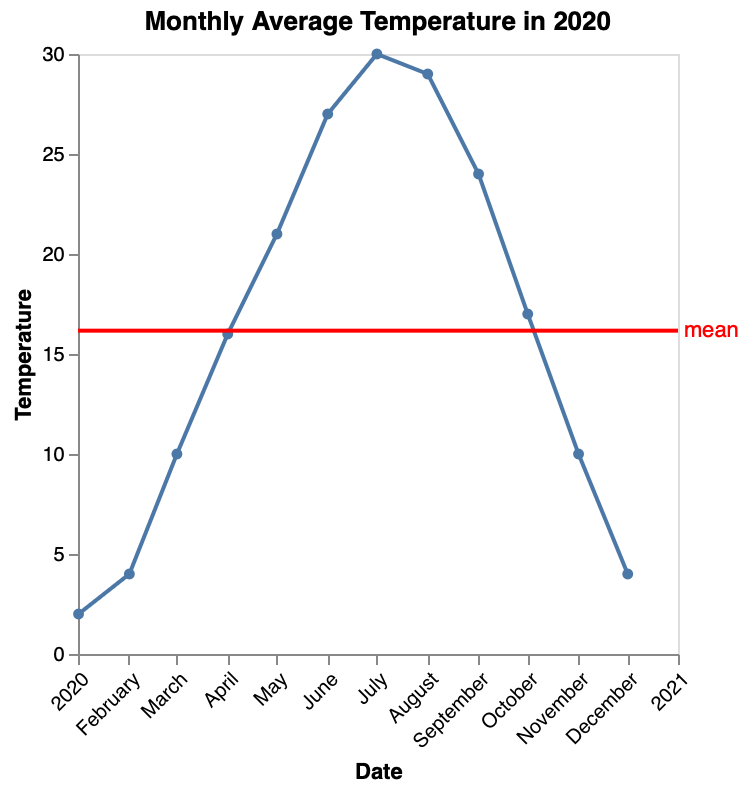
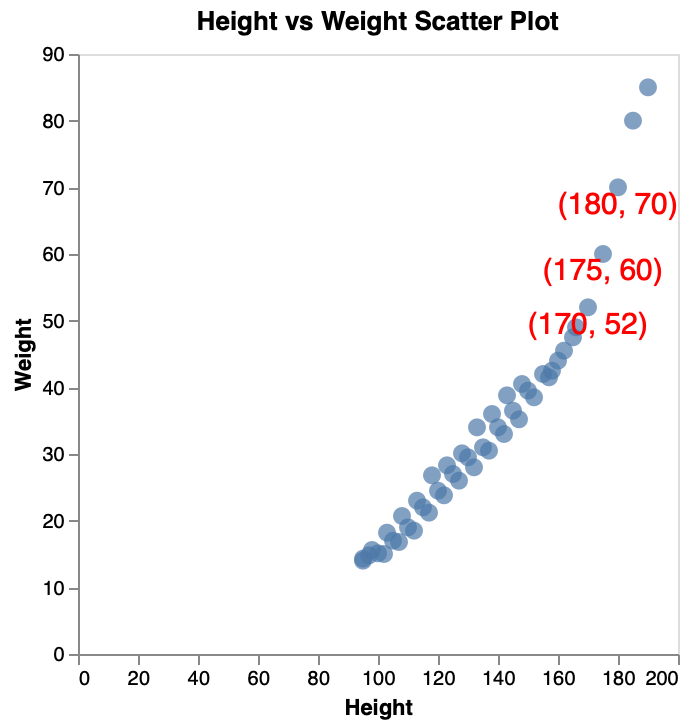
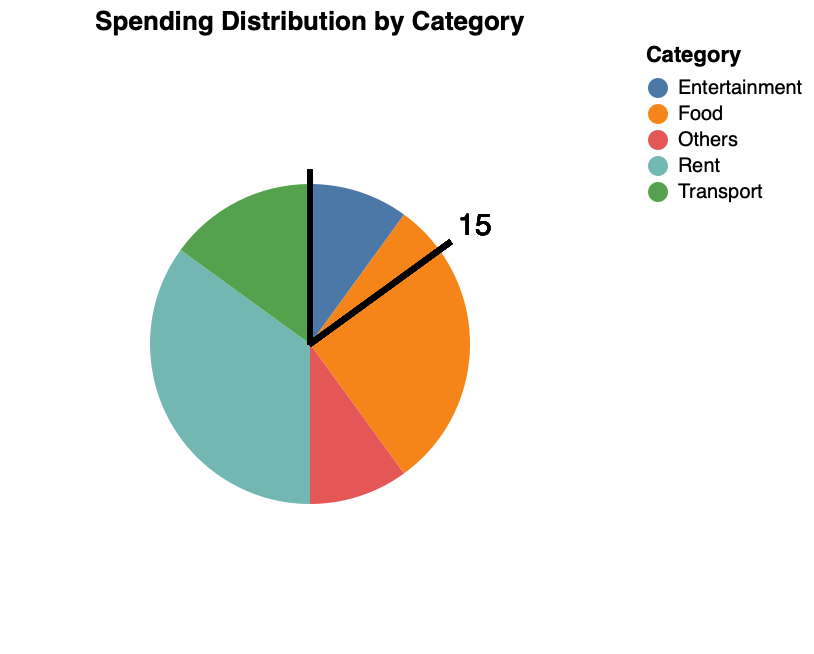
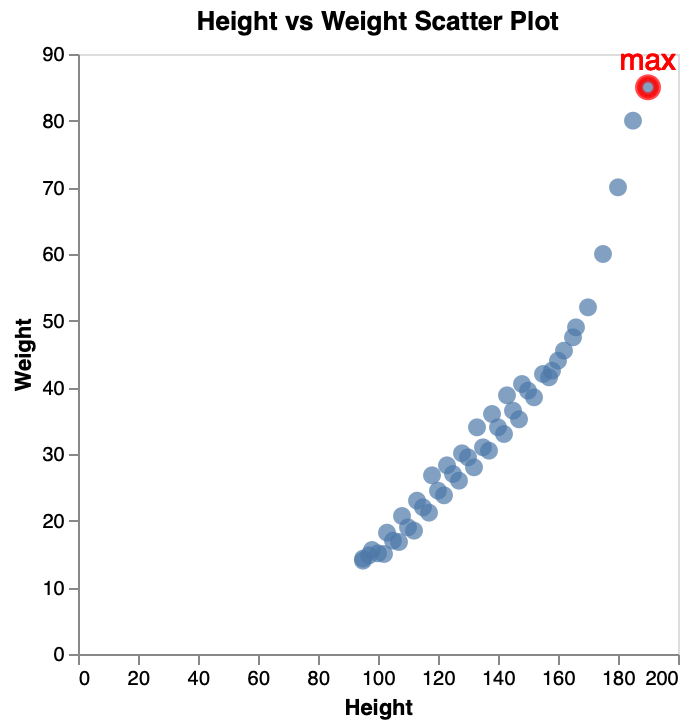
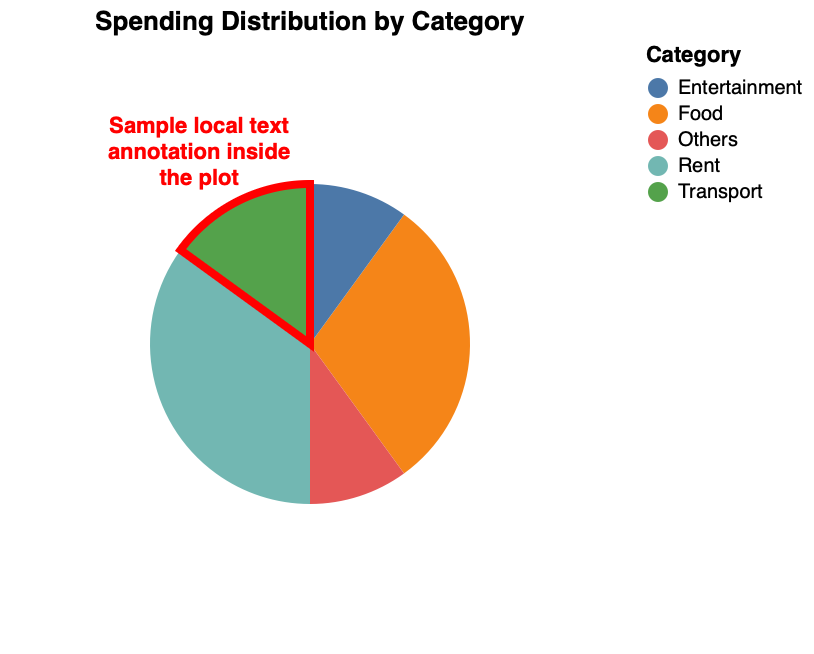
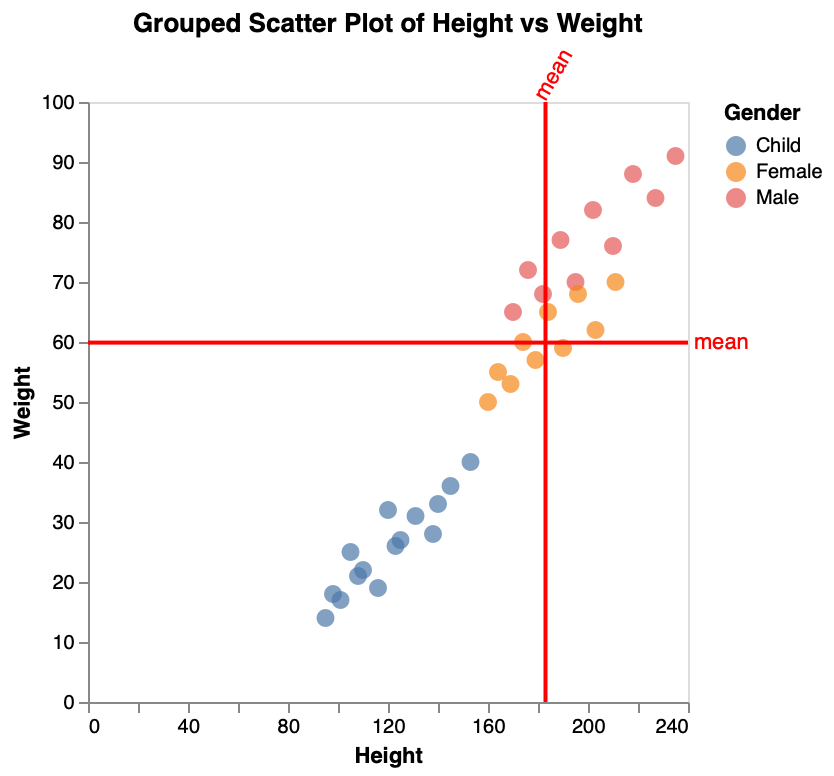
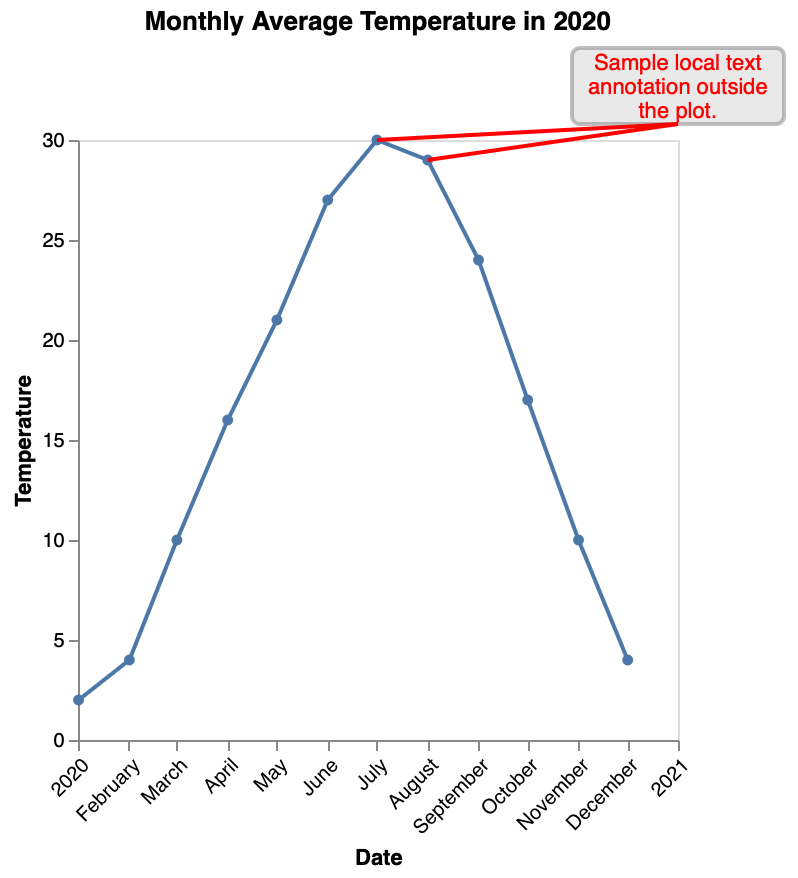
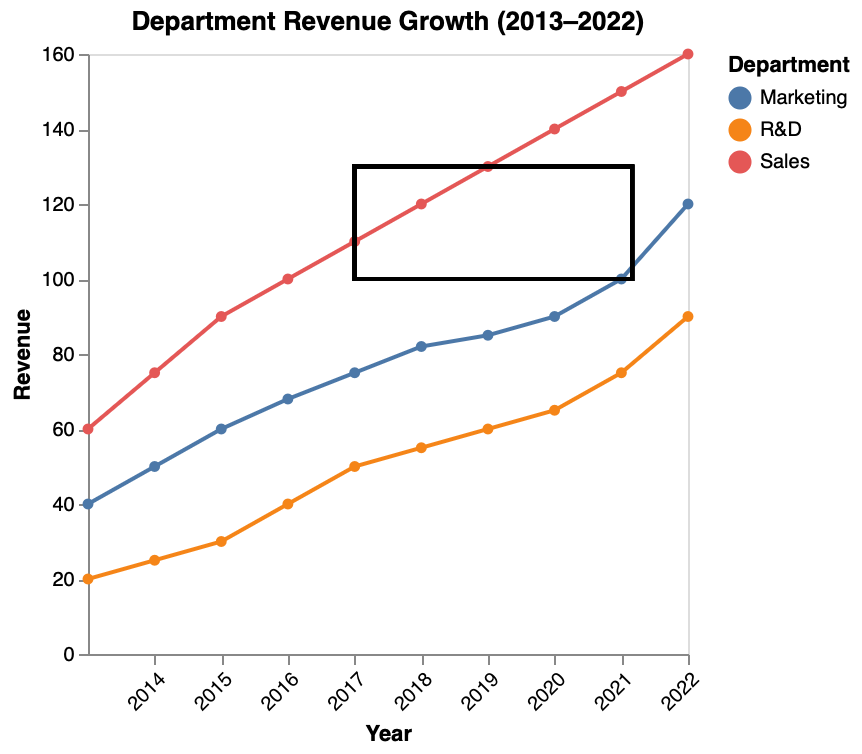
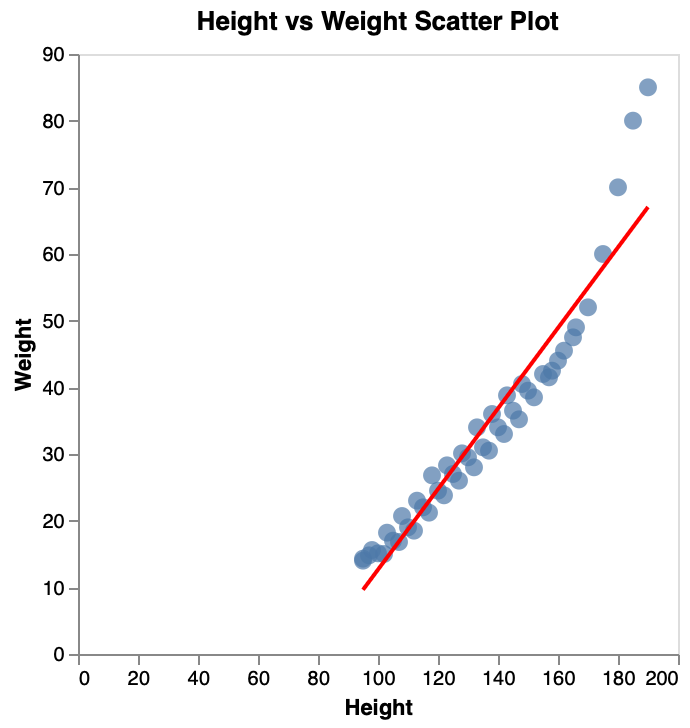
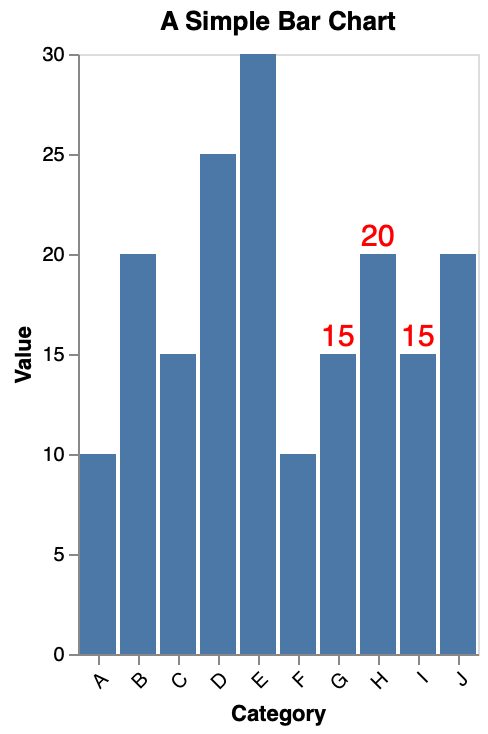
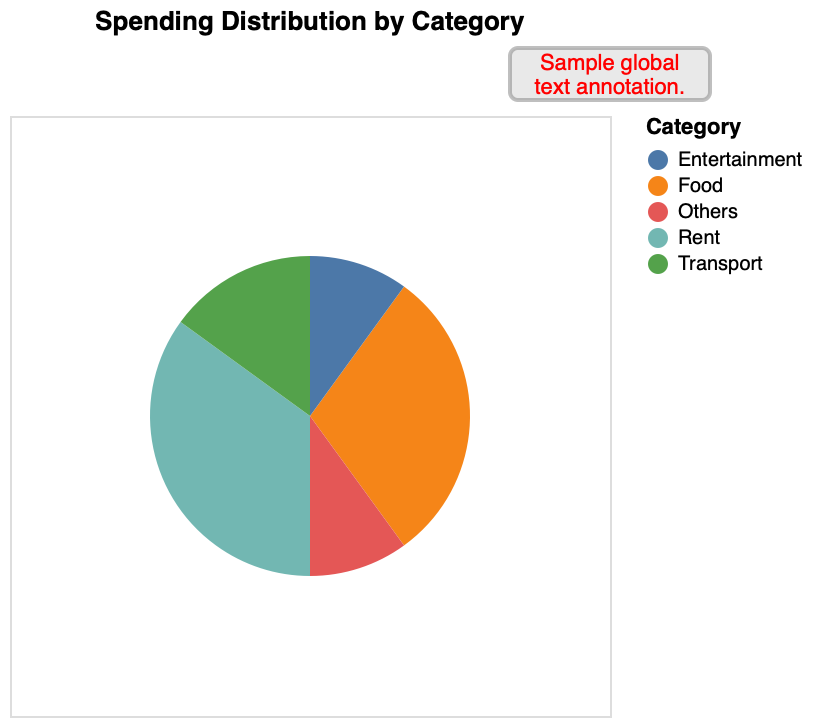
ChartMark specifications describe annotations as mappings from chart elements to annotation techniques, including highlights, markers, text labels, and reference lines. The ChartMark compiler automatically positions annotation components based on a set of carefully designed rules. This approach allows ChartMark specifications to be concise for quick annotation authoring, while giving users control to override defaults and customize various aspects of annotations.

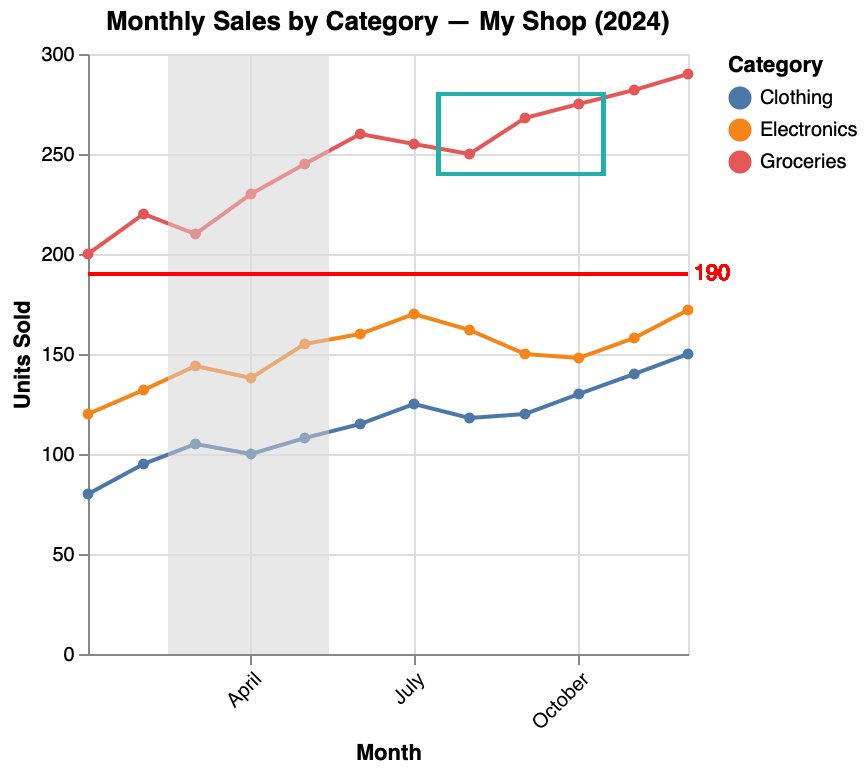
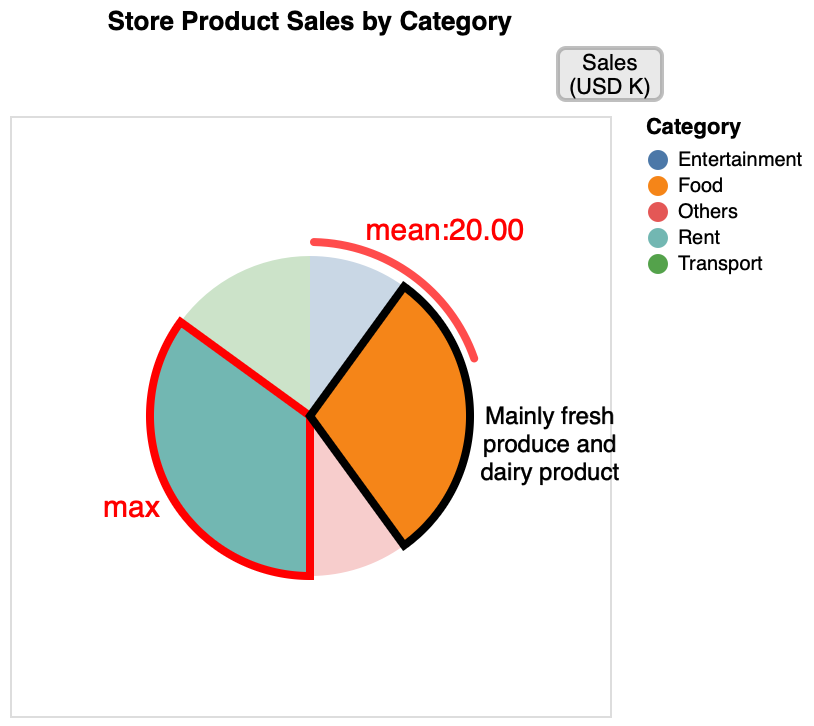
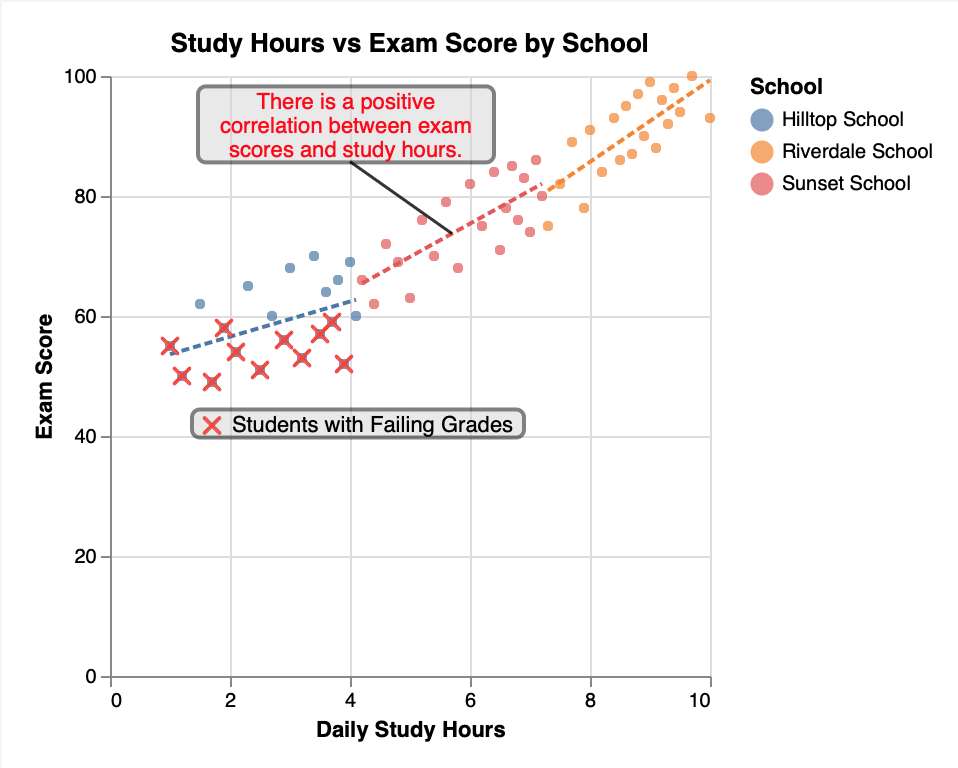
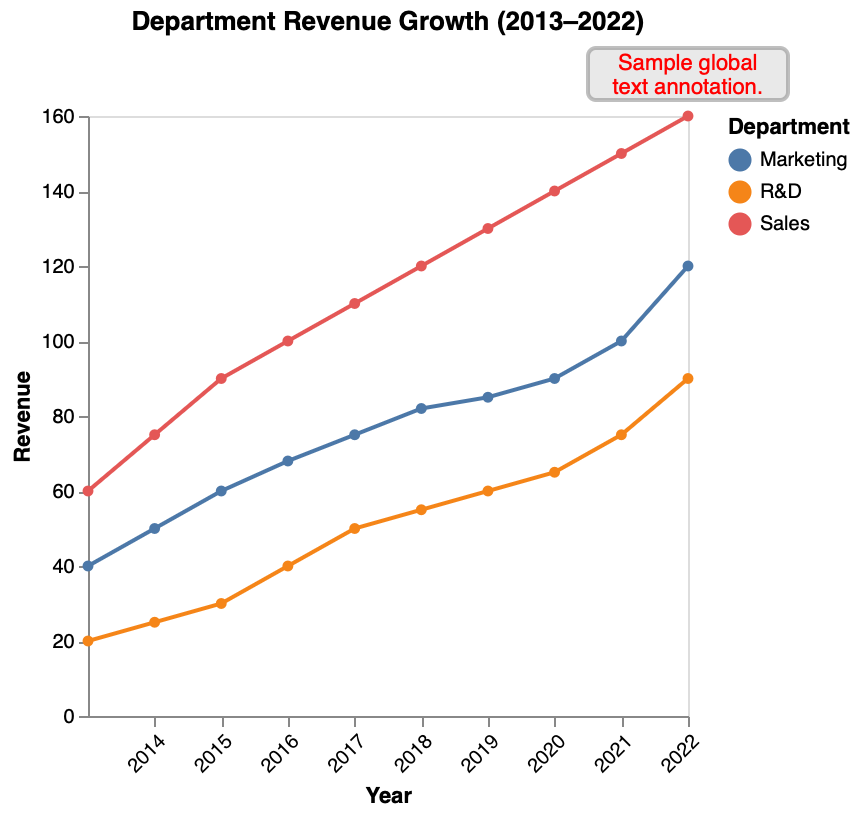
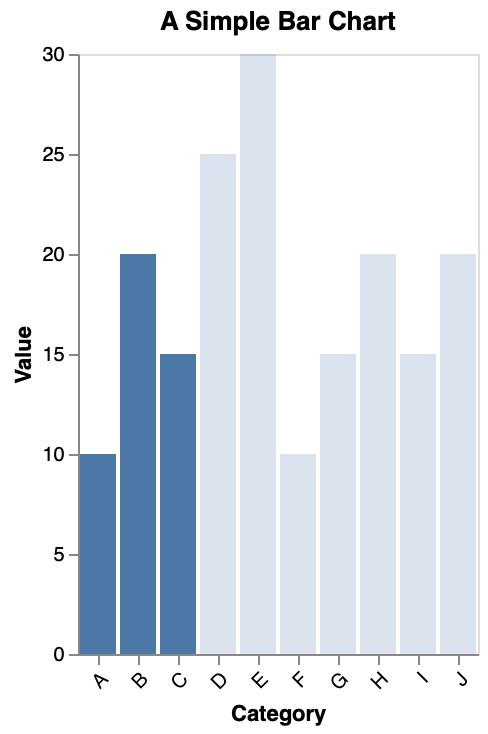
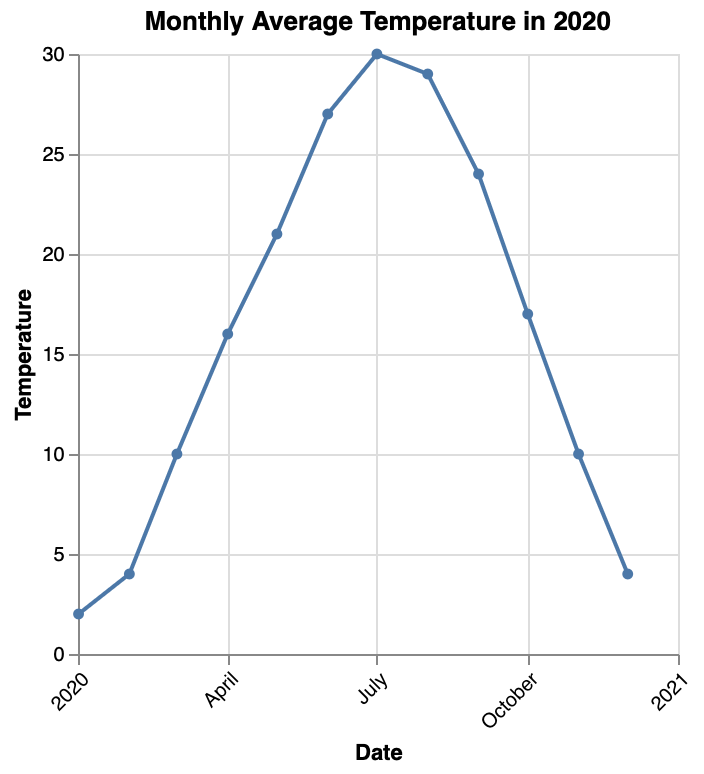
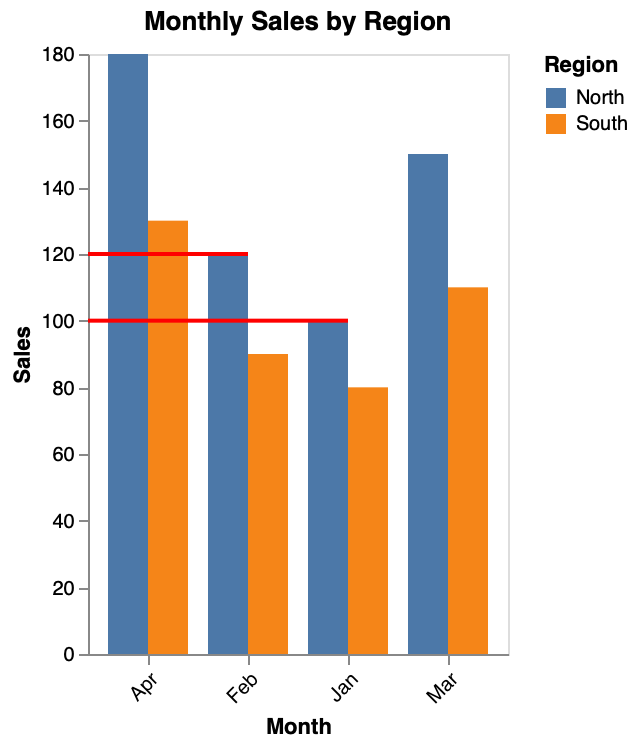
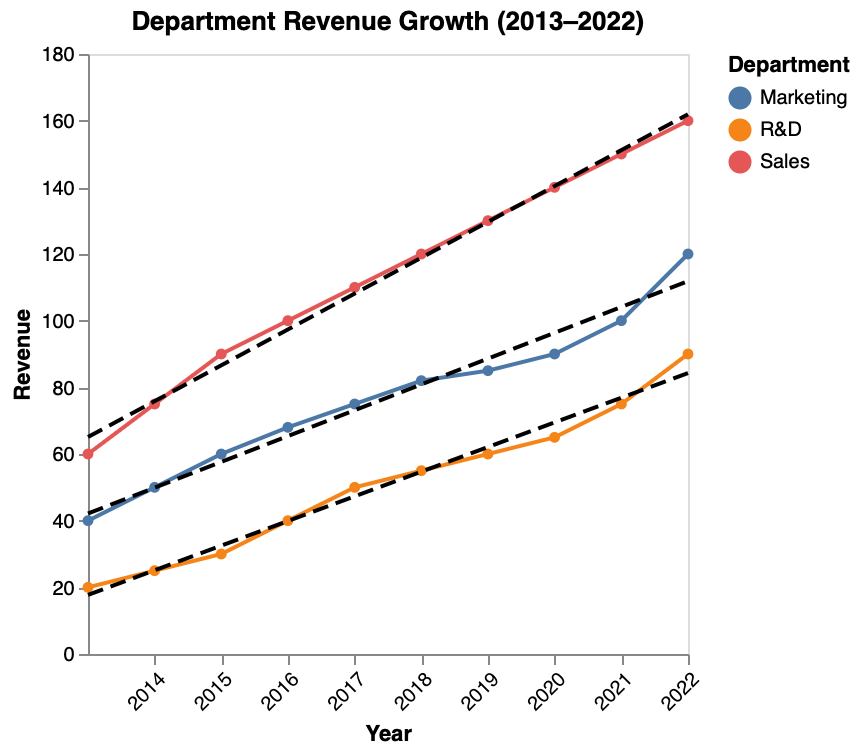
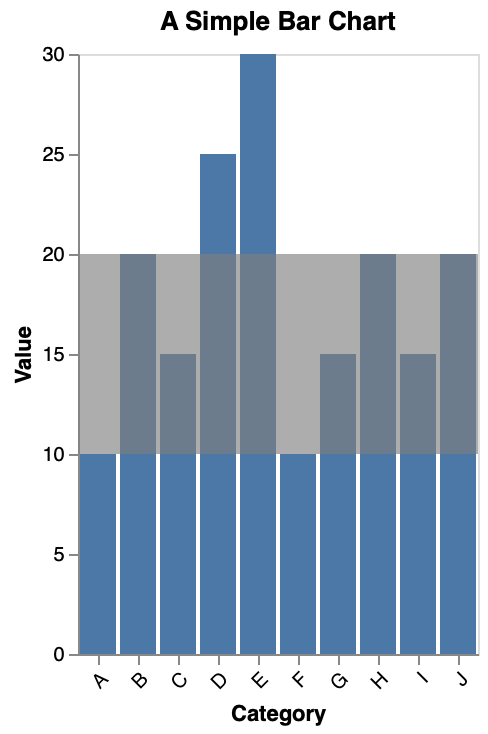
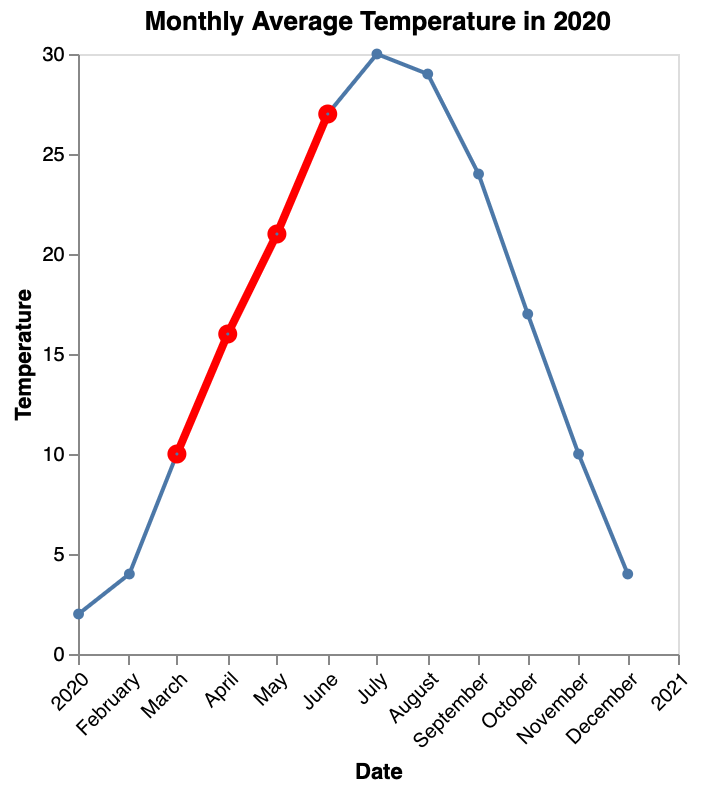
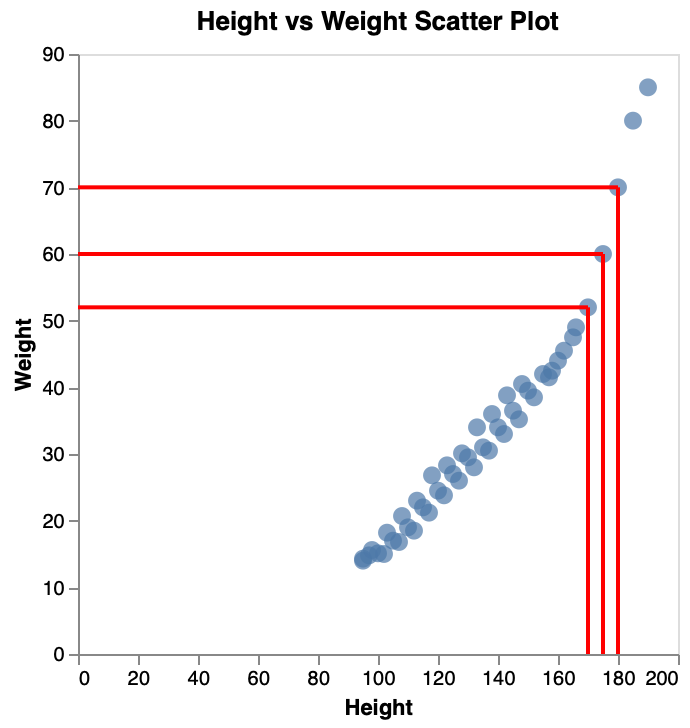
As we designed ChartMark to support data analysis, it supports multiple annotation techniques (such as bounding boxes, labels, shadows, grid lines) and target selectors (such as data items, chart elements, coordinate regions). Moreover, ChartMark specifications can be composed into multi-layered annotations and integrated with interactive features.

Get Started

Latest Version: 0.1.0

Browse Examples

Example

With ChartMark, we can create sophisticated annotations that combine multiple techniques to effectively communicate insights:

Financial Dashboard

Annual Training Budget by Department

Combining reference line, data labels, and highlights

Sports Analytics

Study Hours vs Exam Score by School

Multiple layers of annotations for performance analysis

Key Features

Declarative Syntax

Define complex chart annotations using concise JSON format without writing complex code.

Multiple Techniques

Support for bounding boxes, labels, shadows, arrows, reference lines, and more to meet diverse annotation needs.

Engine Independence

ChartMark specifications can be converted to different visualization engines such as Vega-Lite, ECharts, or D3.js with minimal changes.

VegaLite Integration

Seamlessly integrate with the VegaLite ecosystem to add professional annotations to data visualizations.

Separation of Concerns

Separates annotation intent, content, placement, and rendering logic for greater flexibility and maintainability.

Extensibility

Open architecture design supporting custom annotation techniques and target selectors.

Users

ChartMark can be used by data enthusiasts, developers, journalists, data scientists, teachers, and researchers across many organizations. Here are some of them:

Data Technology Companies
Financial Analysis Firms
Educational Institutions
News Media
Data Visualization Studios
Research Organizations

Team

The development of ChartMark is led by a team of experts in data visualization, including scholars from HKUST(GZ) and HKUST.